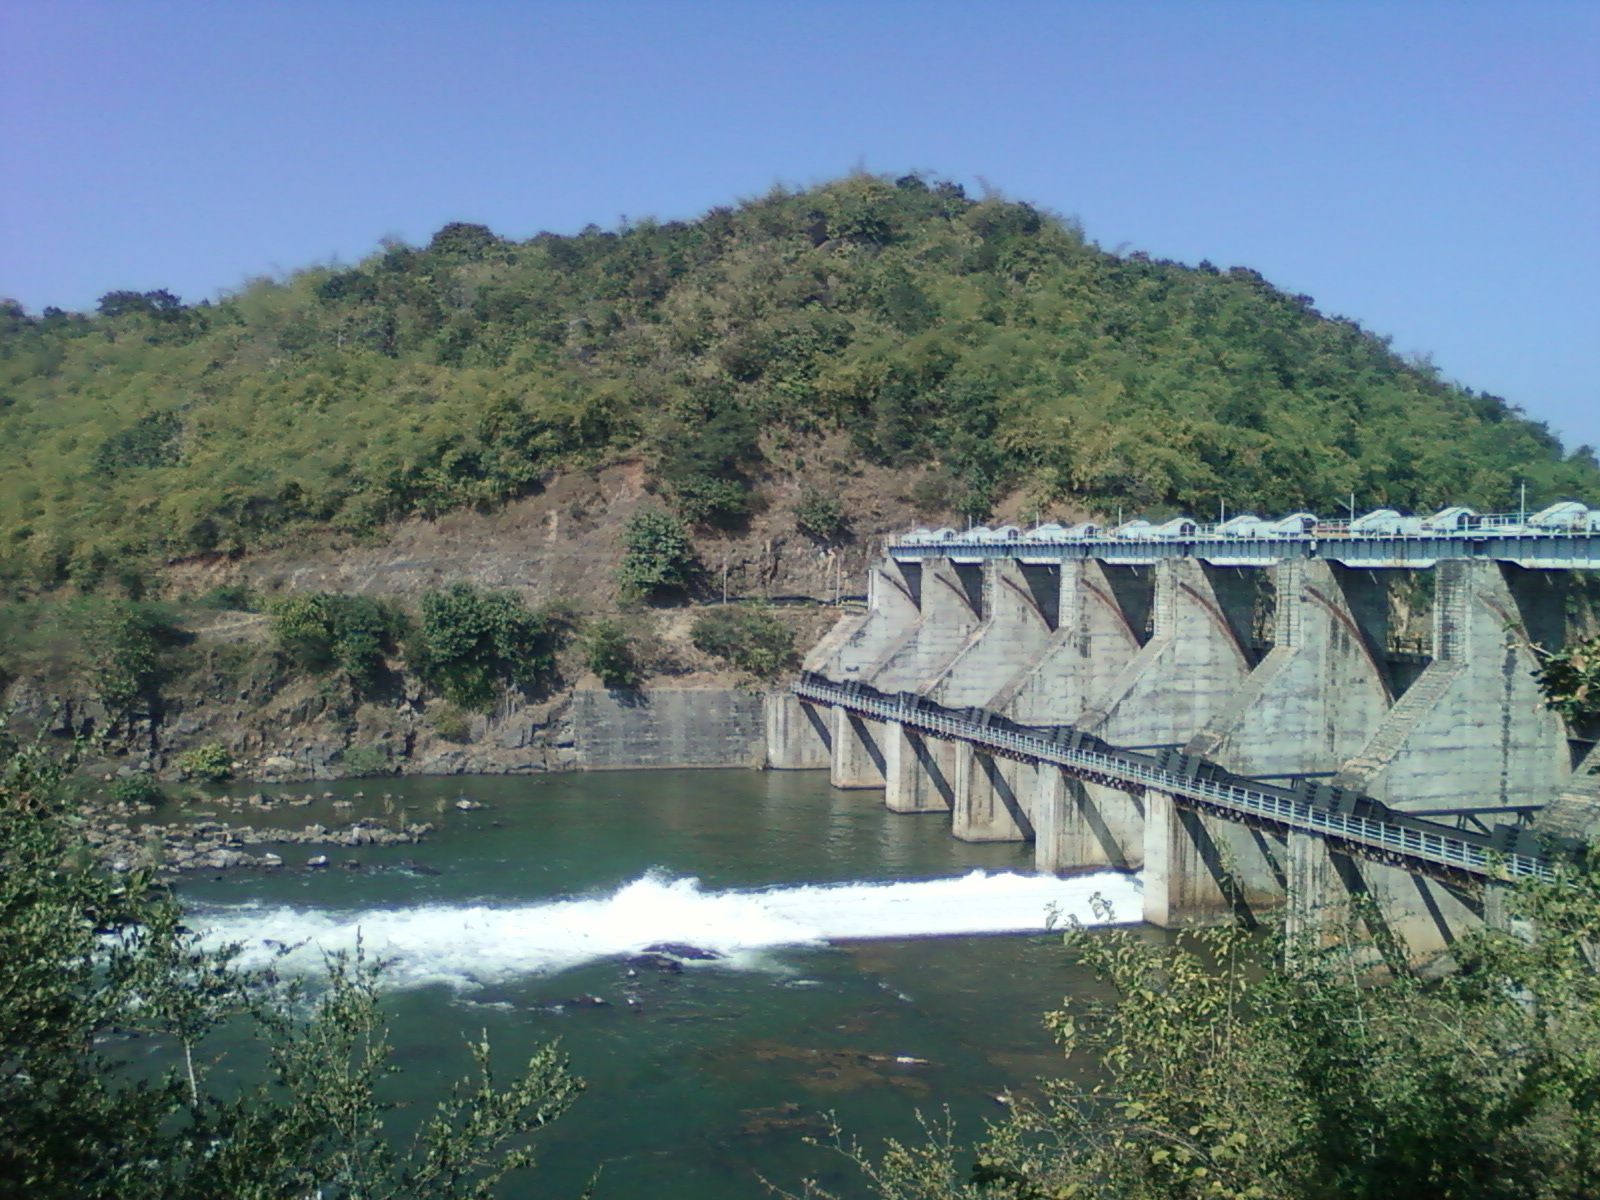
The plant
4.5 MW of clean,
canal-fed power
A small hydro station that runs when the canals run, generating renewable electricity from water released for irrigation.
At a glance
Key facts
The station has three identical 1.5 MW units. They were built in stages: Units 1 and 2 have exported power since 2001, and the third unit is registered with the UN Clean Development Mechanism.
- Installed capacity
- 4.5 MW
- Configuration
- 3 × 1.5 MW turbine-generator units
- Type
- Small hydro, run on irrigation releases
- Water source
- Yeleru reservoir, Yeleru river
- Location
- Yeleswaram, Kakinada District (formerly East Godavari), Andhra Pradesh
- Grid export since
- January 2001
- Cumulative export, Stage I
- 233 GWh (2001–2021)
- UN CDM registration
- Project 9564, registered 31 Jan 2013
How it works
From water to wire
- 01
Reservoir
The Yeleru reservoir stores up to 24.11 TMC of monsoon inflow behind its dam at Yeleswaram, with full reservoir level at +86.56 m.
- 02
Irrigation release
Water is released to the canals according to the irrigation schedule. Irrigation comes first: the plant generates from those releases, it does not set them.
- 03
Turbine hall
The falling water spins 3 turbine-generator units of 1.5 MW each (4.5 MW in all), then flows on into the canal system.
- 04
Grid
Every unit generated is stepped up and fed into the Andhra Pradesh grid. Clean, local, renewable electricity.
Performance
Annual generation, Stage I
| Financial year | GWh |
|---|---|
| 2001-02 | 14.8 |
| 2002-03 | 4.7 |
| 2003-04 | 9.6 |
| 2004-05 | 7.5 |
| 2005-06 | 11.9 |
| 2006-07 | 17.6 |
| 2007-08 | 19.9 |
| 2008-09 | 17.7 |
| 2009-10 | 4.6 |
| 2010-11 | 14.1 |
| 2011-12 | 17.4 |
| 2012-13 | 12.8 |
| 2013-14 | 13.1 |
| 2014-15 | 9.2 |
| 2015-16 | 5.9 |
| 2016-17 | 5.8 |
| 2017-18 | 7.8 |
| 2018-19 | 11.3 |
| 2019-20 | 12.7 |
Water stays in the system
Water passes through the turbines and flows on into the canals. None is consumed.
Low-carbon electricity
Hydro output displaces fossil-fuelled grid power: an estimated 7,876 tCO₂ a year for the CDM-registered unit alone.
Local supply
Power is generated and consumed within the region, which cuts transmission losses on the rural grid.
Talk to us
For grid, regulatory or partnership enquiries, reach our registered office in Ravulapalem.
Contact details